Application performance
How to profile your application and use advanced MVsharp features to improve the performance of your application.
Introduction
There is a significant difference between MVsharp, which uses SQL Server as its database, and traditional MultiValue platforms. Where traditional MultiValue platforms run both the database and application on the same piece of hardware, MVsharp allows a multi-tiered architecture where database and application can reside on different servers. This calls for different approaches to configuring your application to obtain best performance. The following need to be taken into consideration:
-
Each access to the database is a request that is sent from the application server to the SQL host, so network latency needs to be taken into consideration.
-
Writing separate records to the database requires a request for each update. Large batch updates need to be configured for performance.
-
Each MVsharp row is stored as a dynamic array in SQL server (key value pair). When selecting large tables the MVsharp normalization engine in SQL needs to normalize the data before selecting. Using MVsharp indexes can significantly reduce the amount of work that needs to be done in SQL.
-
Pick style dictionaries (A and S) do not specify if a field is single valued or multi valued so MVsharp assumes all Pick style dictionaries are multi valued. This has a performance impact.
-
Translates to other files require additional SQL reads for each record in the primary file. Performance can be vastly improved by using MVsharp joins.
-
Performance tools in MVsharp and SQL server. There is a host of valuable tools that can be used to diagnose the interactions between MVsharp and SQL Server.
MVsharp profiling
Most modern development environments have many tools that analyze your running application and can highlight areas that can be tuned for better performance. MVsharp has a profiling engine built into the core of the product. The engine can be enabled to gather profiling information to enable you to pinpoint areas where performance can be improved.
The profiling engine gathers statistics in the following areas:
-
Database operations. Database IO probably causes most applications not to run optimally. These statistics enable you to see what files have been accessed and the types of IO operations on them.
-
Subroutine calls. By gathering statistics on all subroutine calls including the number of times each is called, the duration for the subroutine to complete and the minimum and maximum times, you can identify slow running programs.
-
Executes. Complex selection criteria can often slow a process down. The execute statistics show the duration, program name and line number to enable you to quickly locate long running selects and to correct them with indexes or by changing the order of the selection criteria.
-
Itypes. Complex Itypes can often cause reports to run slowly. The Itype statistics enable you to quickly locate those.
Profiling can be turned on at TCL by typing:
>PROFILE ON
All activity will then be captured from that point. To turn off profiling, type:
>PROFILE OFF
Profiling can be used to track an application and take corrective action.
Database Caching
Reducing the amount of IO between the application server and the SQL server can improve the performance of your application. Caching should only be used when running batch processes or reports and not for transactional processes. There are 2 scenarios where we can apply caching.
-
Records from a file are read multiple times from within the same process. When we turn caching on for that file, the record is read once from SQL Server and then from the cache for subsequent reads, reducing the calls to SQL server. In this scenario we just cache the required files and BASIC programs stay as they are.
-
Records that don't exist in the file are read because we are just checking if they exist. When the application does this, the records won't exist in the cache and therefore a read from SQL is required. In this scenario, we cache the file, read each row in the database and modify the programs to use the READCACHE and READCACHEV statements in place of READ and READV.
Determining which files to cache
We use MVsharp profiling to determine which files to cache. Turn profiling on and run the process. When the process has completed, we use the following command to display file activity.
>PROFILE DISPLAY FILEIO

File Access Statistics Page 1 17:03:41 02-25-22 02-25-22

File Name Cache   Writes  Reads   Deletes   Selects   Unique
---------------   ------  -----   -------   -------   ------  ----
_VOC              0       7       0         0         5       0
_CUST             0       2505    0         0         501     0
In the above example, we can see that the CUST file was read 2505 times with only 501 unique keys. This indicates that the file is a good candidate for caching to reduce IO.
Pre-caching of files
Records from an active list are streamed and only send 1 request to SQL; all other reads require a request to SQL server for each record. We reduce the IO to SQL server by pre-caching a file and then reading the entire file into cache. This uses memory but significantly reduces IO to SQL server.
Example:
PROGRAM TEST
OPEN "CUST" TO F.CUST ELSE STOP 201,"Unable to open CUST"
CACHE("_CUST")
SELECT F.CUST TO 9
LOOP
   READNEXT ID FROM 9 ELSE EXIT
   READ REC FROM F.CUST , ID ELSE REC = ""
REPEAT
*
Any subsequent reads will only be from cache, greatly enhancing performance.
Using READCACHE and READCACHEV
To determine whether we need to use READCACHE or READCACHEV, we use the SQL Server profiler. The profiler records every interaction your application has with SQL server. The process is as follows:
- Open SQL Server Management Studio.
- From the Tools menu, select the profiler.
- Add the above pre-caching technique to your application.
- Run the application with the profiler on.
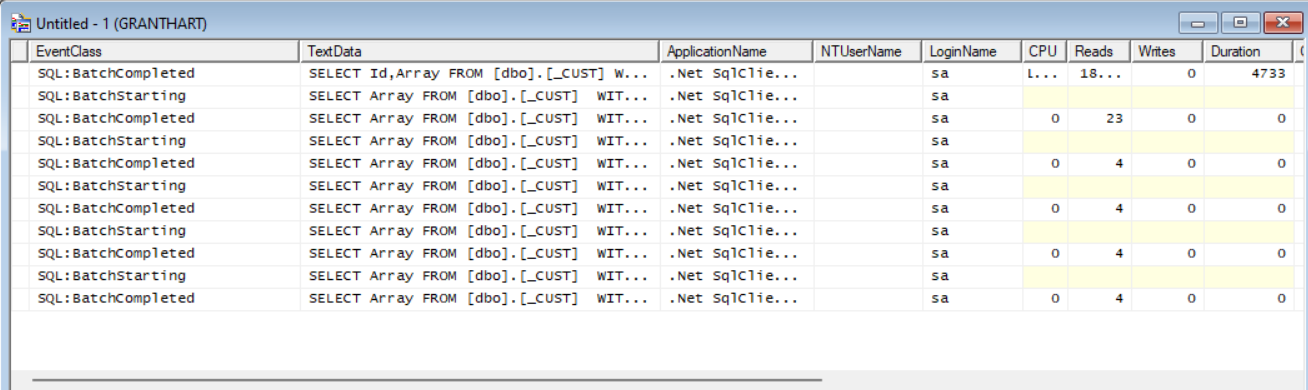
From the above you can see that even though we have cached the file and read all records, the application is still sending requests to SQL indicating that it is reading non-existent records.
Changing the READ statements to READCACHE will only read from the cache and not from SQL server.
Batching Updates
Programs that update large numbers of records in a batch send an UPDATE statement to SQL for each update. This is not efficient, as there is always latency on each call. In order to improve efficiency, 2 new statements have been added to MVsharp to allow you to batch up a certain number of updates and then send them as batches improving performance.
Example:
PROGRAM Update
OPEN "CUST" TO F.CUST ELSE STOP 201,"Unable to open CUST"
BATCHSTART(F.CUST,1000)
SELECT F.CUST TO 9
LOOP
   READNEXT ID FROM 9 ELSE EXIT
   READ REC FROM F.CUST , ID THEN
      REC<5> = 0
      WRITE REC ON F.CUST , ID
   END
REPEAT
BATCHEND(F.CUST)
*
In the above example, the BATCHSTART(F.CUST,1000) indicates that a single batch of 1000 records will be sent to SQL server for every 1000 updates to the CUST file.
The BATCHEND(F.CUST) will flush any remaining updates since the last batch of 1000 records.
A and S dictionaries vs D types and I types
A and S dictionaries do not have the capability to determine whether a field is single or multi valued and are treated as multi valued at all times.
In MVsharp the SQL engine needs to try and expand all multi values which is time consuming. In order to improve database access, A and S types should be converted to D and I types.
Dictionary format:
| Field | Example | Description |
|---|---|---|
| 1 | D or I | Type of dictionary. |
| 2 | 1 | Field number or Itype expression. |
| 3 | MD2 | Conversion Code. |
| 4 | Amount | Description and Heading. |
| 5 | 20L | Width and Justification. |
| 6 | S | S for single value M for multi value. |
| 7 | ||
| 8 | DECIMAL(18,2) | Sql Datatype. Should be specified when using field as an index or in a SQL view. |
Note
Itypes that call the SUBR statement cannot be executed in SQL Server or persisted for indexes. Where possible, implement the code in the Itype rather than calling the SUBR statement.
Indexing to improve SELECT performance
Each SELECT is translated into a SQL statement and the MVsharp normalization engine embedded in SQL server normalizes the MV data to select the records on the fly.
SELECT performance can be improved by creating indexes on specific fields in the file that are used as selection criteria.
When analysing your application to determine which fields to create an index on, MVsharp profiling can collect all statements that are executed and display the time it took for the selection to take place.
Turn PROFILE ON and execute your application:
>PROFILE DISPLAY EXECUTES

Execute Statistics Page 1 19:42:56 02-25-22 02-25-22
Subroutine  Name   Lineno  Time  Command
----------  ----   ------  ----  -------
X           28769  SELECT  CUST  WITH F1 # ''
>
From the above we can see the subroutine 'X' executed the SELECT statement and it took 28 seconds. Based on this information where queries take long, create indexes on the appropriate fields.
Note
Itypes that do a translate to another table cannot be indexed. See Using Joins to improve translate performance to address performance on translates.
MVsharp also has a global logging of executes which can be turned on in the MVSHARP.CONFIG file with the LOGEXECUTE flag. This logs executes from all processes on the system.
Example:
2/25/2022 11:43:00 AM 0     BOWO    SELECT BRANCH-REGIONS BY REGION WITH MGR "BOWO" OR WITH ASSTMGR "BOWO" OR WITH ROIS "BOWO"
2/25/2022 11:46:23 AM 0     BOWO    SELECT BRANCH BY BR# WITH STATUS "ACTIVE" AND WITH MGR "BOWO" OR WITH ASSTMGR "BOWO" OR WITH ROIS "BOWO" OR WITH REGMGR "BOWO" OR WITH WHSEMGR "BOWO"
2/25/2022 11:46:23 AM 0     BOWO    SELECT BRANCH-REGIONS BY REGION WITH MGR "BOWO" OR WITH ASSTMGR "BOWO" OR WITH ROIS "BOWO"
2/25/2022 11:46:26 AM 0     BOWO    LISTU
2/25/2022 11:46:26 AM 0     BOWO    LOGOFF 3356
2/25/2022 11:46:26 AM 0     BOWO    MVS.ASSIGN.PORT
2/25/2022 11:46:27 AM 0     BOWO    SELECT BRANCH BY BR# WITH STATUS "ACTIVE" AND WITH MGR "BOWO" OR WITH ASSTMGR "BOWO" OR WITH ROIS "BOWO" OR WITH REGMGR "BOWO" OR WITH WHSEMGR "BOWO"
2/25/2022 11:46:27 AM 0     BOWO    SELECT BRANCH-REGIONS BY REGION WITH MGR "BOWO" OR WITH ASSTMGR "BOWO" OR WITH ROIS "BOWO"
It shows the date, time, port number, user and the select statement.
Using Joins to improve translate performance
As mentioned, translated data cannot be indexed. SQL has the ability to use a JOIN on 2 tables to compare data between 2 tables.
In order to create a join there are 2 dictionaries that are required.
- A dictionary in the primary file that resolves the key to the second file.
- A dictionary in the secondary file that returns the field.
All dictionaries in the join must be converted to D types.
Example:
In the above example, the key to the secondary file is FIELD(@ID,"*",1). We need to create an index on the primary file for the remote key. We create a new dictionary as follows:
ACCKEY

0001: I
0002: FIELD(@ID,"*",1)
0003:
0004: Account Key
0005: 20L
0006: S
0007:
0008: VARCHAR(20)
Then index it:
Attribute 14 (the field to be returned) already has a dictionary called TRACE, so we index it:
The format for creating a join is:
CREATE.JOIN {LocalFile} {DictionaryId} {KeyToRemote} ON {RemoteFile} {RemoteColumn}
>CREATE.JOIN AP-EXP-GL TRACE ACCKEY ON ACCOUNTS TRACE
Using SQL Server profiler
The SQL server profiler allows you to evaluate all interactions with SQL server from MVsharp applications. It is very useful, as mentioned earlier, for finding specific queries that could be executed by a program.
The types of information you can derive from the profiler are:
- What tables are being accessed at a point in time.
- The SQL query that is being executed (translated from MVsharp query)
- Locate the same record that is being read multiple times (redundant reads)
- The time and processing required to execute a query
To start the profiler: 1. Start SSMS and log in. 2. Select Profiler from the 'Tools' menu. 3. Run the profiler.
The profiler shows the following information:
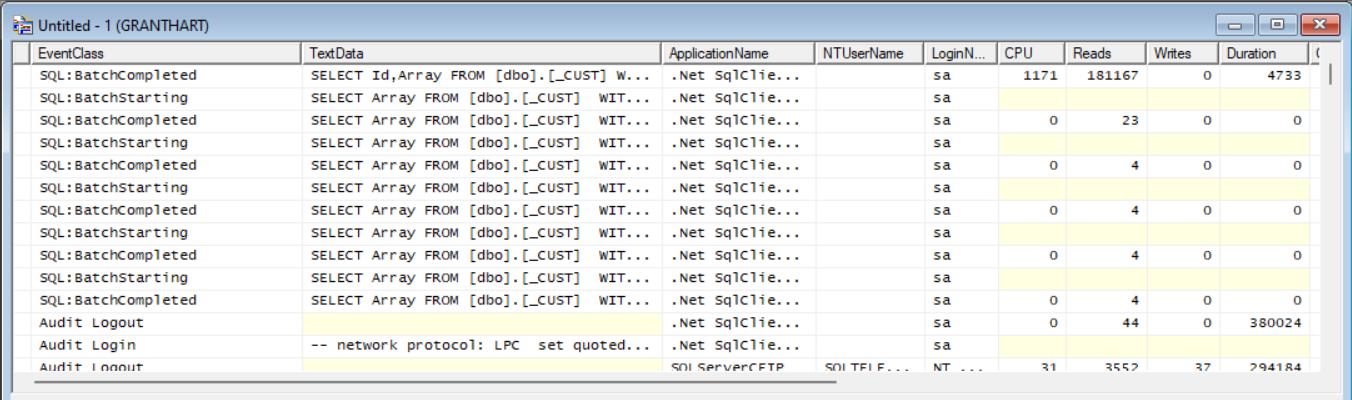
Columns of interest:
| Column | Description |
|---|---|
| TextData | The SQL query that is being executed. |
| CPU | The amount of CPU used by the query. High values indicate impact on SQL. |
| Reads | Number of page reads for the query. |
| Writes | Number of page writes for the query. |
| Duration | Indicates in milliseconds how long the query took. |